Introduction
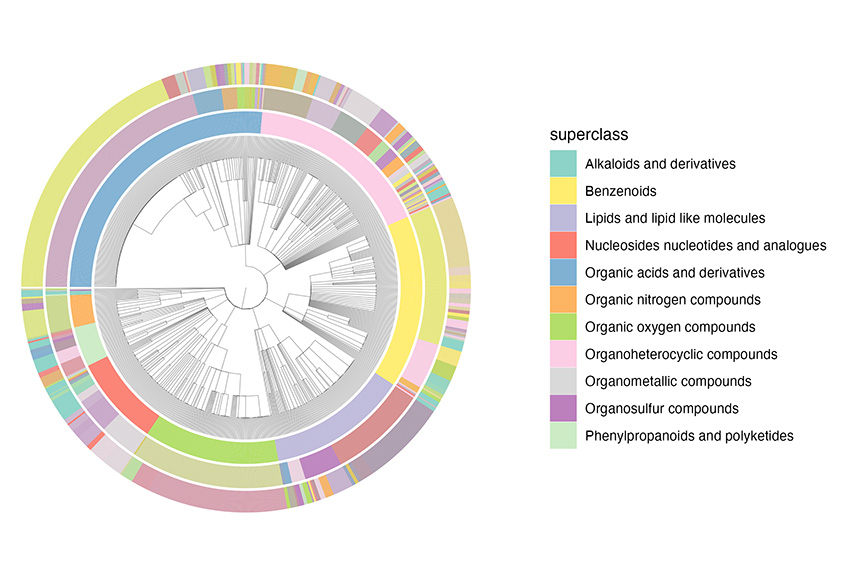
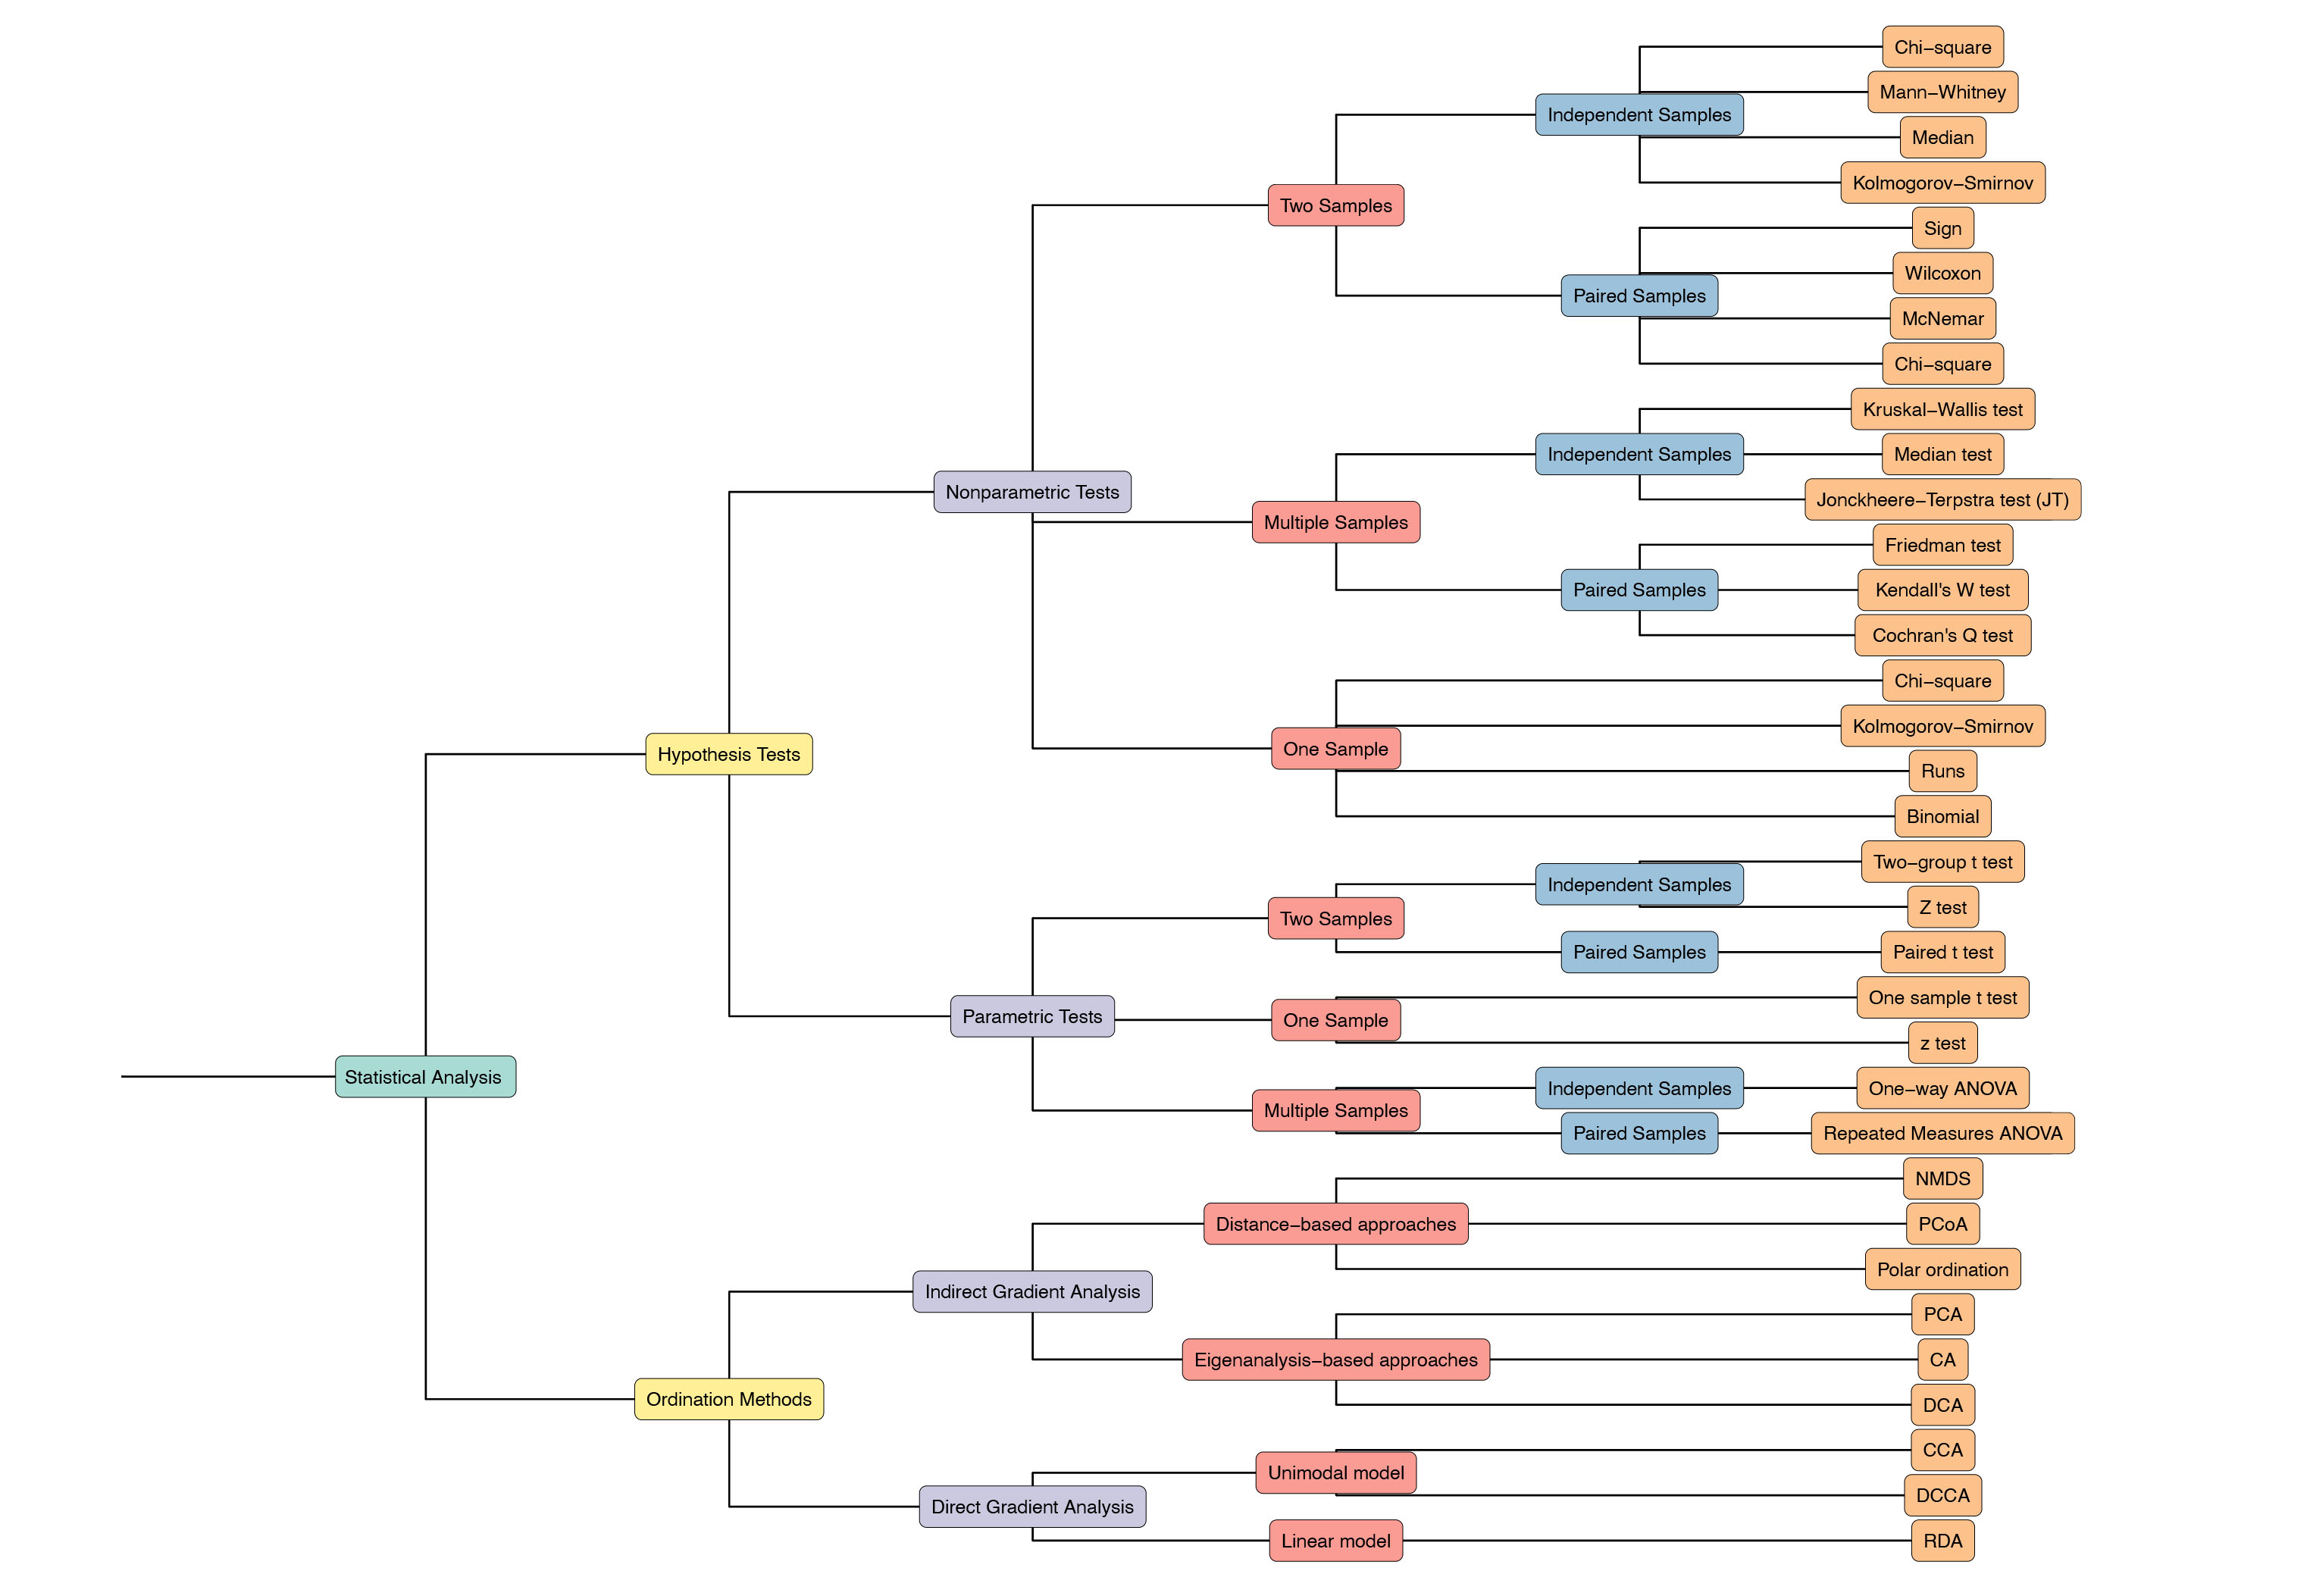
The iPhylo Visual is designed to facilitate the display, inspection, and annotation of phylogenetic, chemical classification trees and tree-based structures. This help page aims to provide a comprehensive introduction to the key features and workflow of our website. We kindly request that you contact us if you have any inquiries or require assistance.
Tree upload
To upload a tree, clicke the "Upload Tree" file input widget in the sidebar of the "Dashboard" page.
Trees should adhere to one of the following file formats: Newick, Nexus, PhyloXML, and Phylip. Please select the appropriate file format from the dropdown menu located next to the upload widget. Failure to select the correct file format may result in the tree not being loaded correctly.
Here are some examples of each supported file format:
Dashboard interface overview
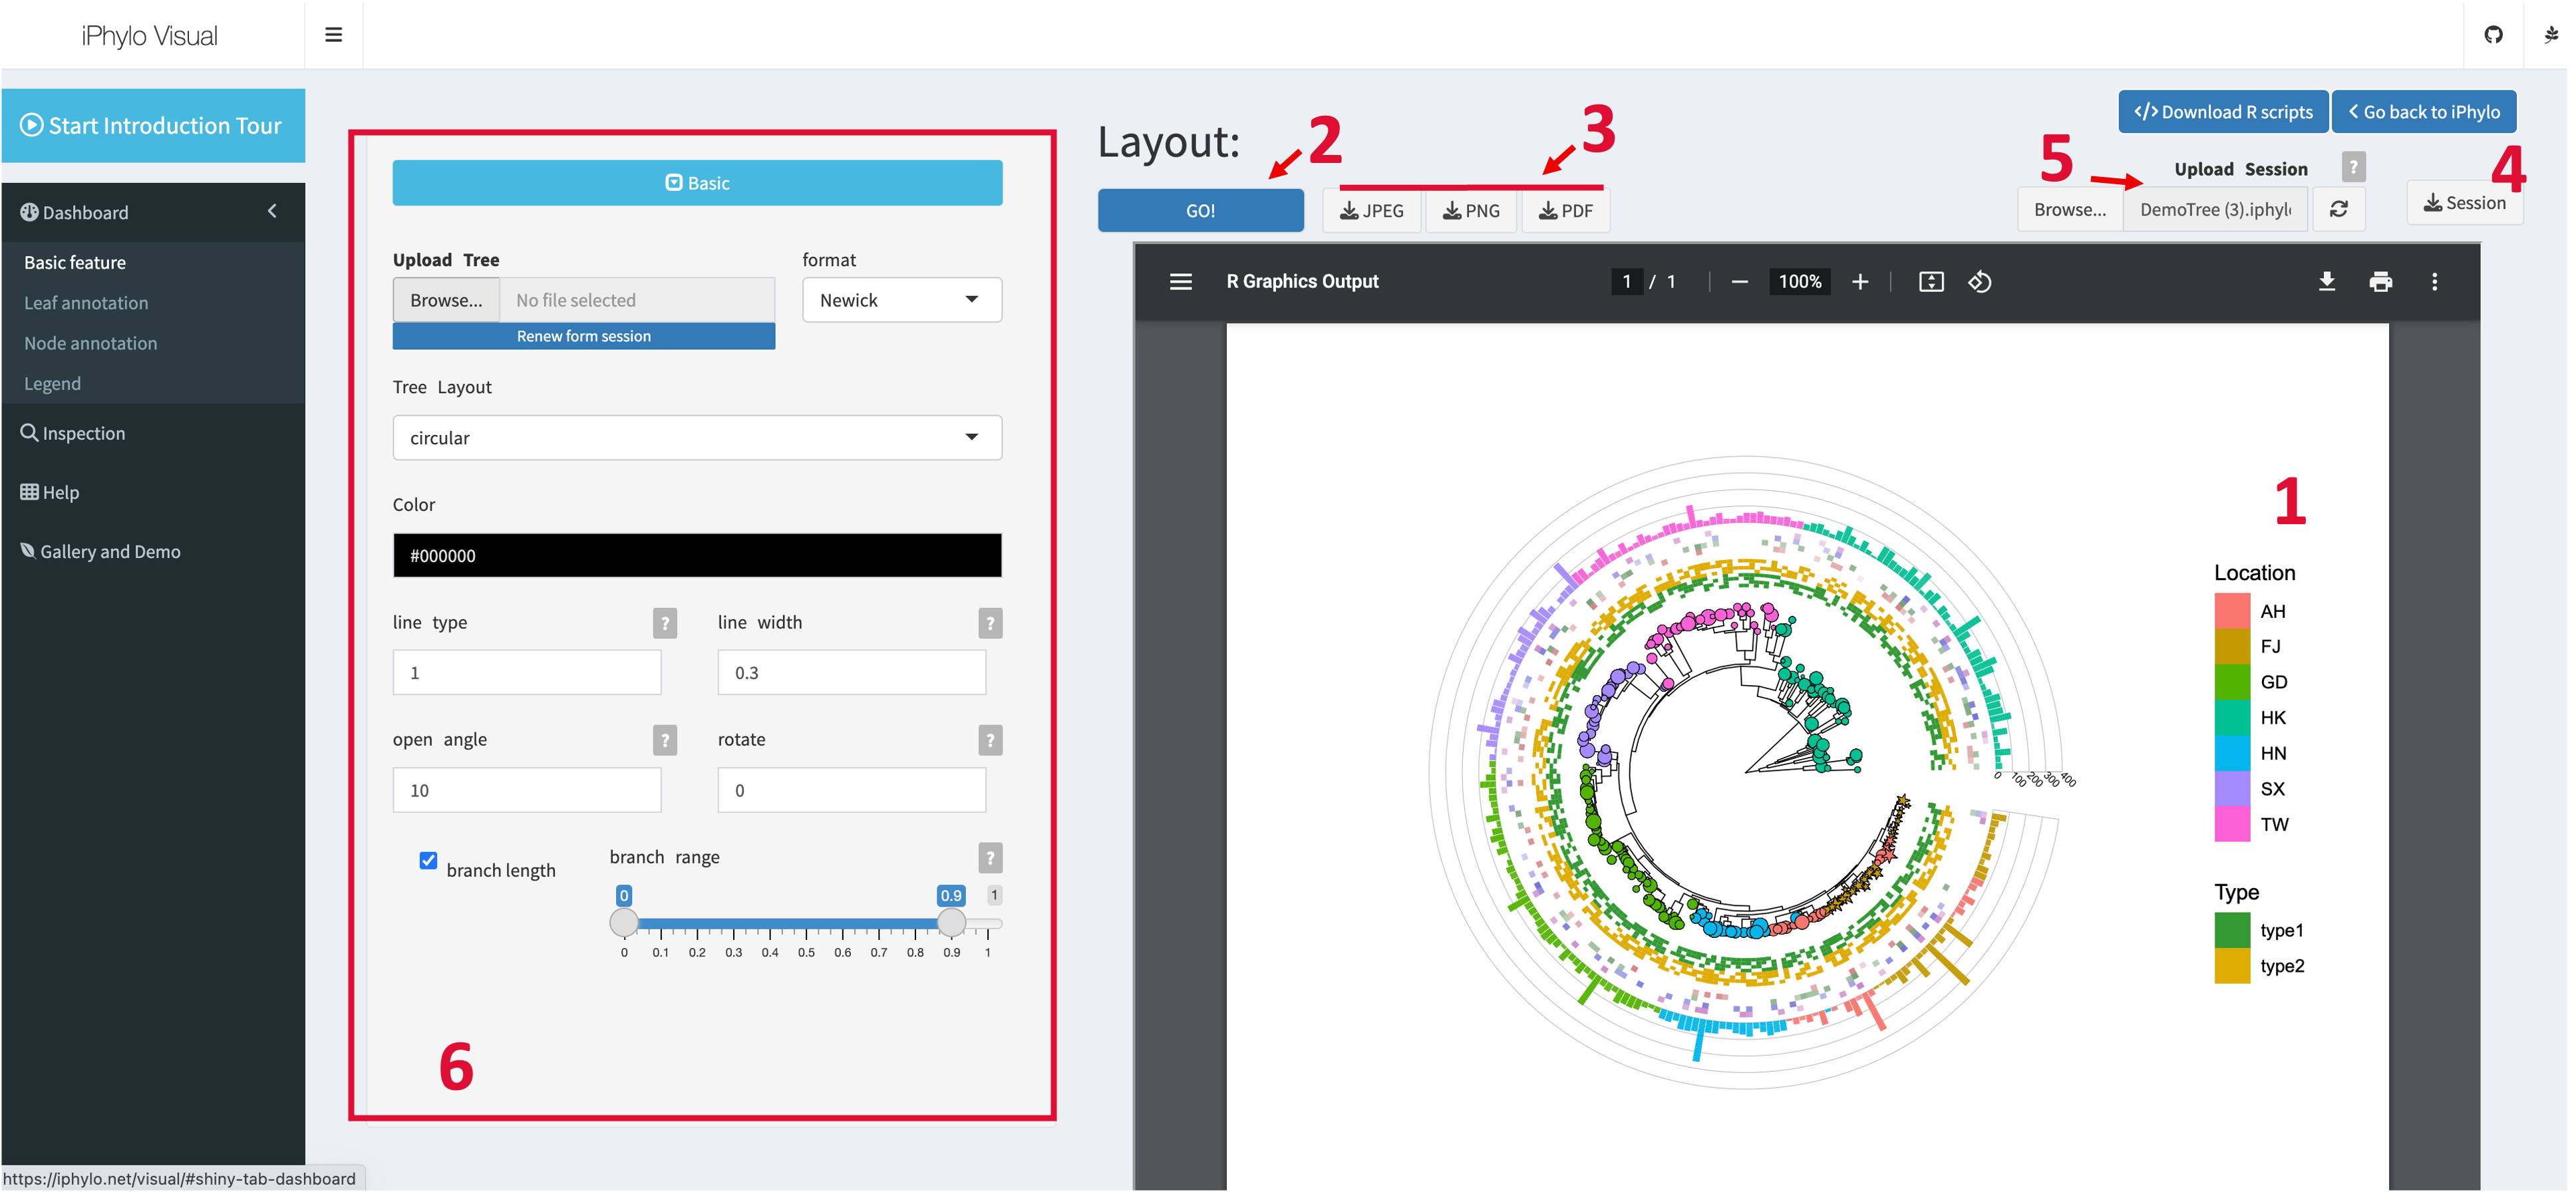
The dashboard page hosts the main annotation and display functions of iPhylo Visual. The user interface consists of several main components:
- Tree Display: The tree will be displayed in the main panel of the webpage in the form of a vector image. Click the plus (+) and minus (-) buttons on the display panel to zoom in and out of the tree visualization. Move and scroll the mouse cursor to move the visualization within the display panel.
- Refresh Plot: Once the user uploads a tree file, the GO button, which is used to refresh the graphical representation of the tree file, will become enabled. To ensure optimal performance, adjustments made to the display or annotation parameters will not immediately update the tree image. Instead, you need to click the "GO" button to refresh the image after modifying any settings.
- Download Plot: Click the JPEG, PNG or PDF download button to get the visualization in preferred formats.
- Download Session:Click the Session button to download the ".iphylo" project file, as detailed in the Session section.
- Upload Session: The session upload widget allows users to upload previously saved project files. Click the reload buttonto restore session data. You need to click the GO button to get the session visualization.
- Basic Controls: This is the basic control panel. iPhylo Visual's basic controls allow users to adjust the fundamental attributes of the tree display. Click the toggle button to collapse or expand the basic control section.
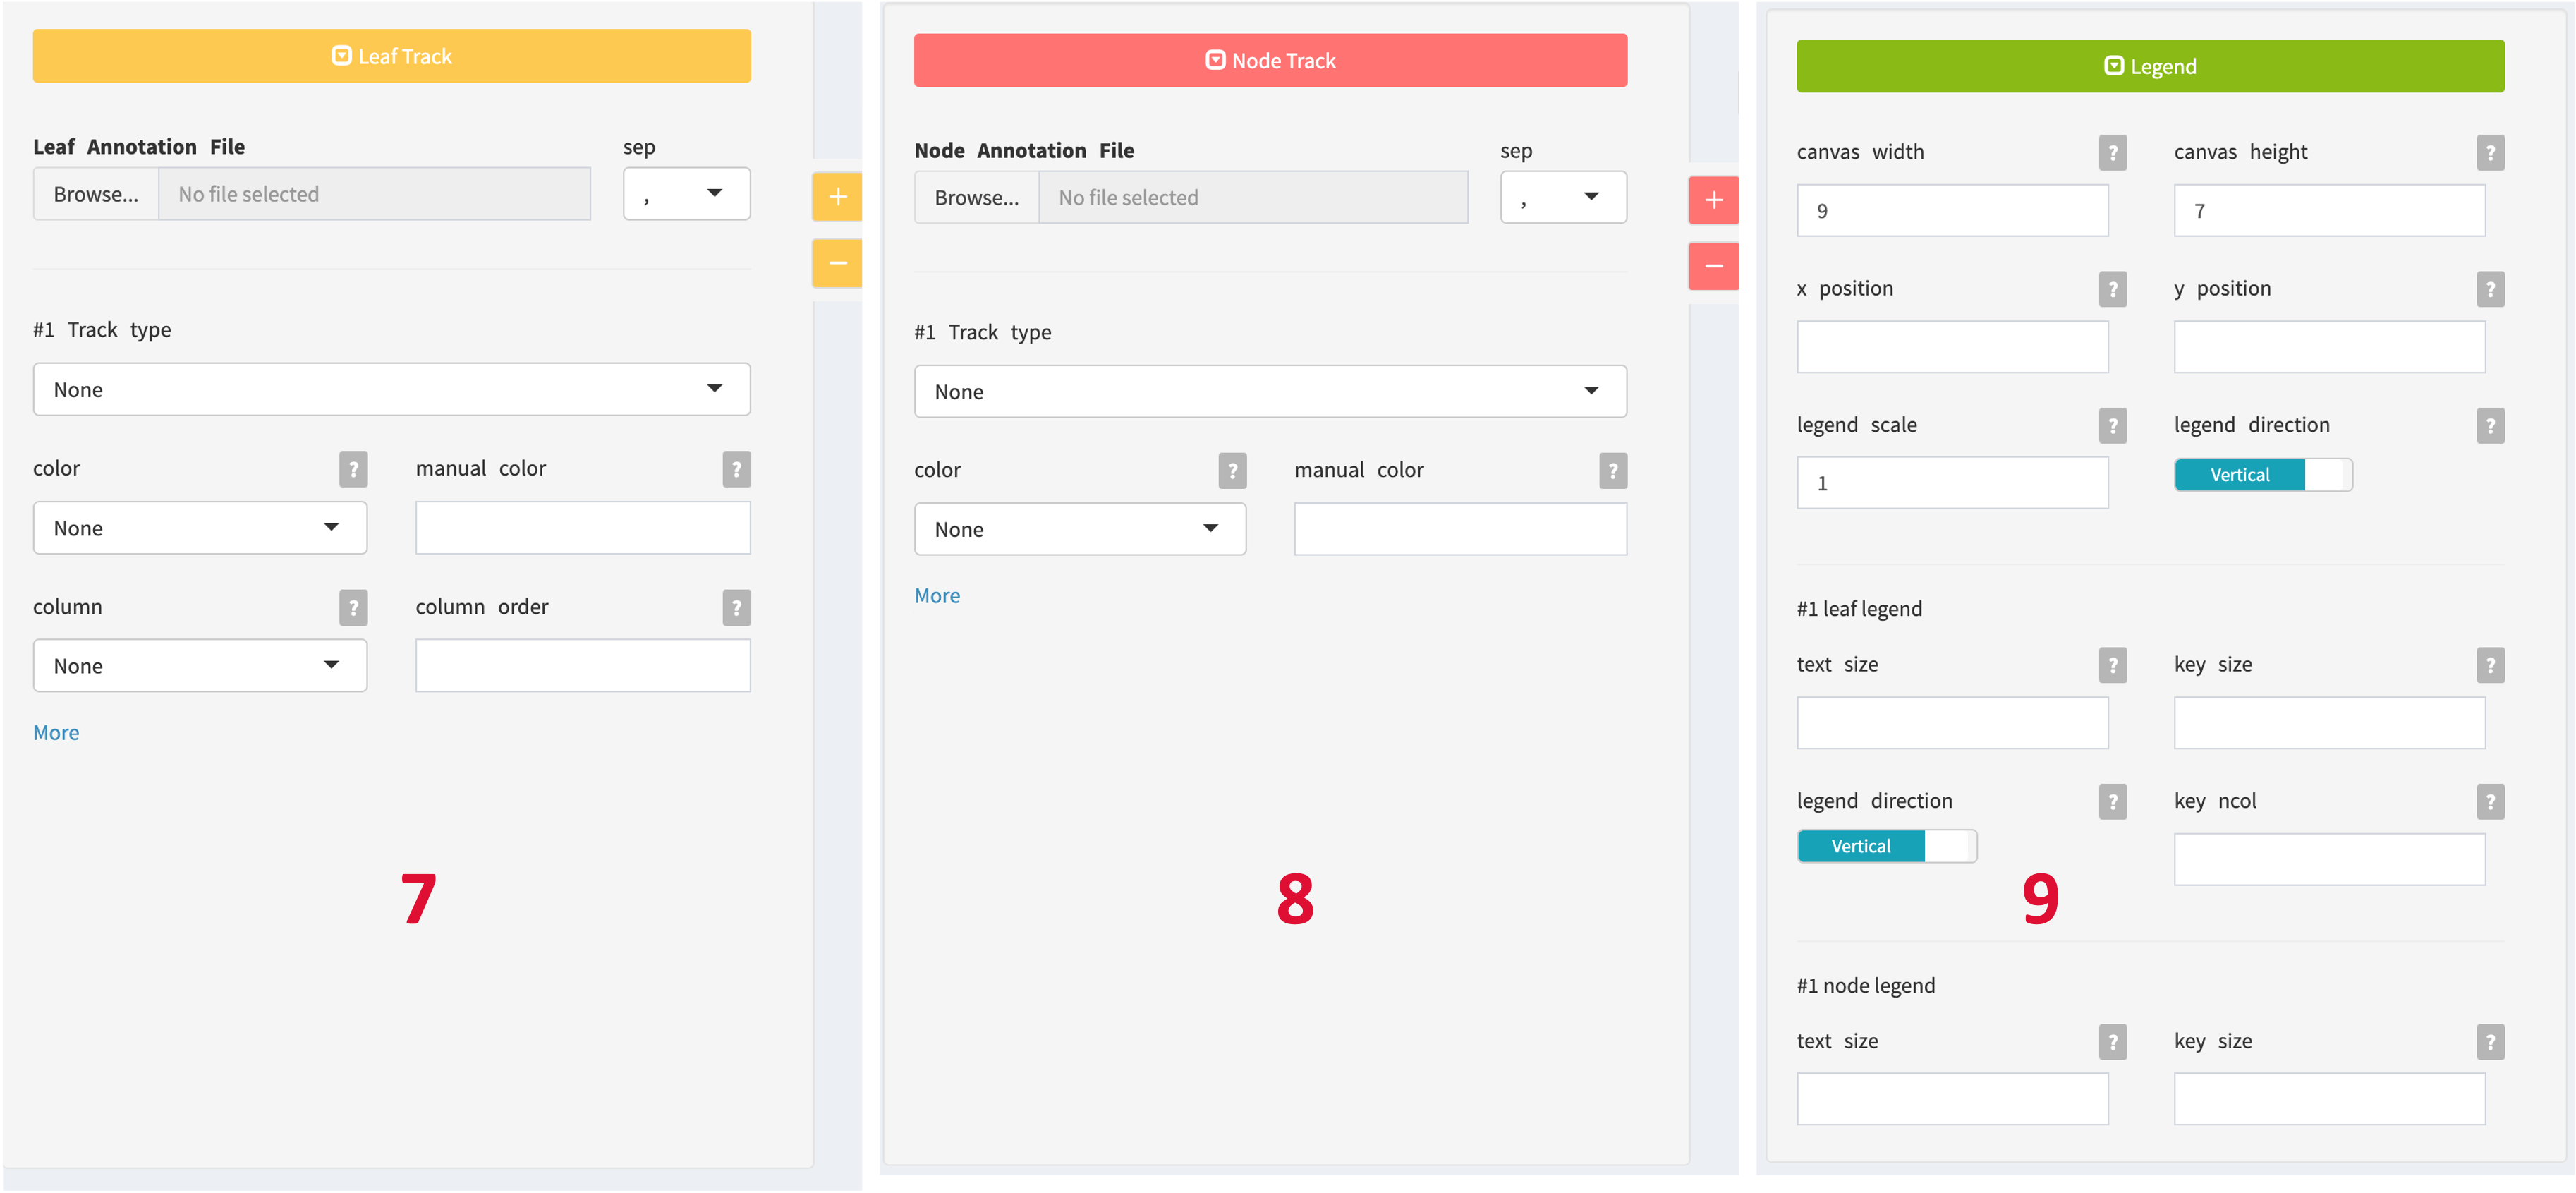
- Leaf Annotation: Use these controls to assign annotation to the external tree nodes. Click the toggle button to collapse or expand the Leaf Annotation section. Click the plus () and minus () buttons of Leaf Annotation to add or remove annotation tracks.
- Node Annotation: Use these controls to assign annotation to the internal tree nodes. Click the toggle button to collapse or expand the Node Annotation section. Click the plus () and minus () buttons of Node Annotation to add or remove annotation tracks.
- Legend Control: This control panel allows you to adjust the canvas size and legends for each annotation layer.
Inspection interface overview
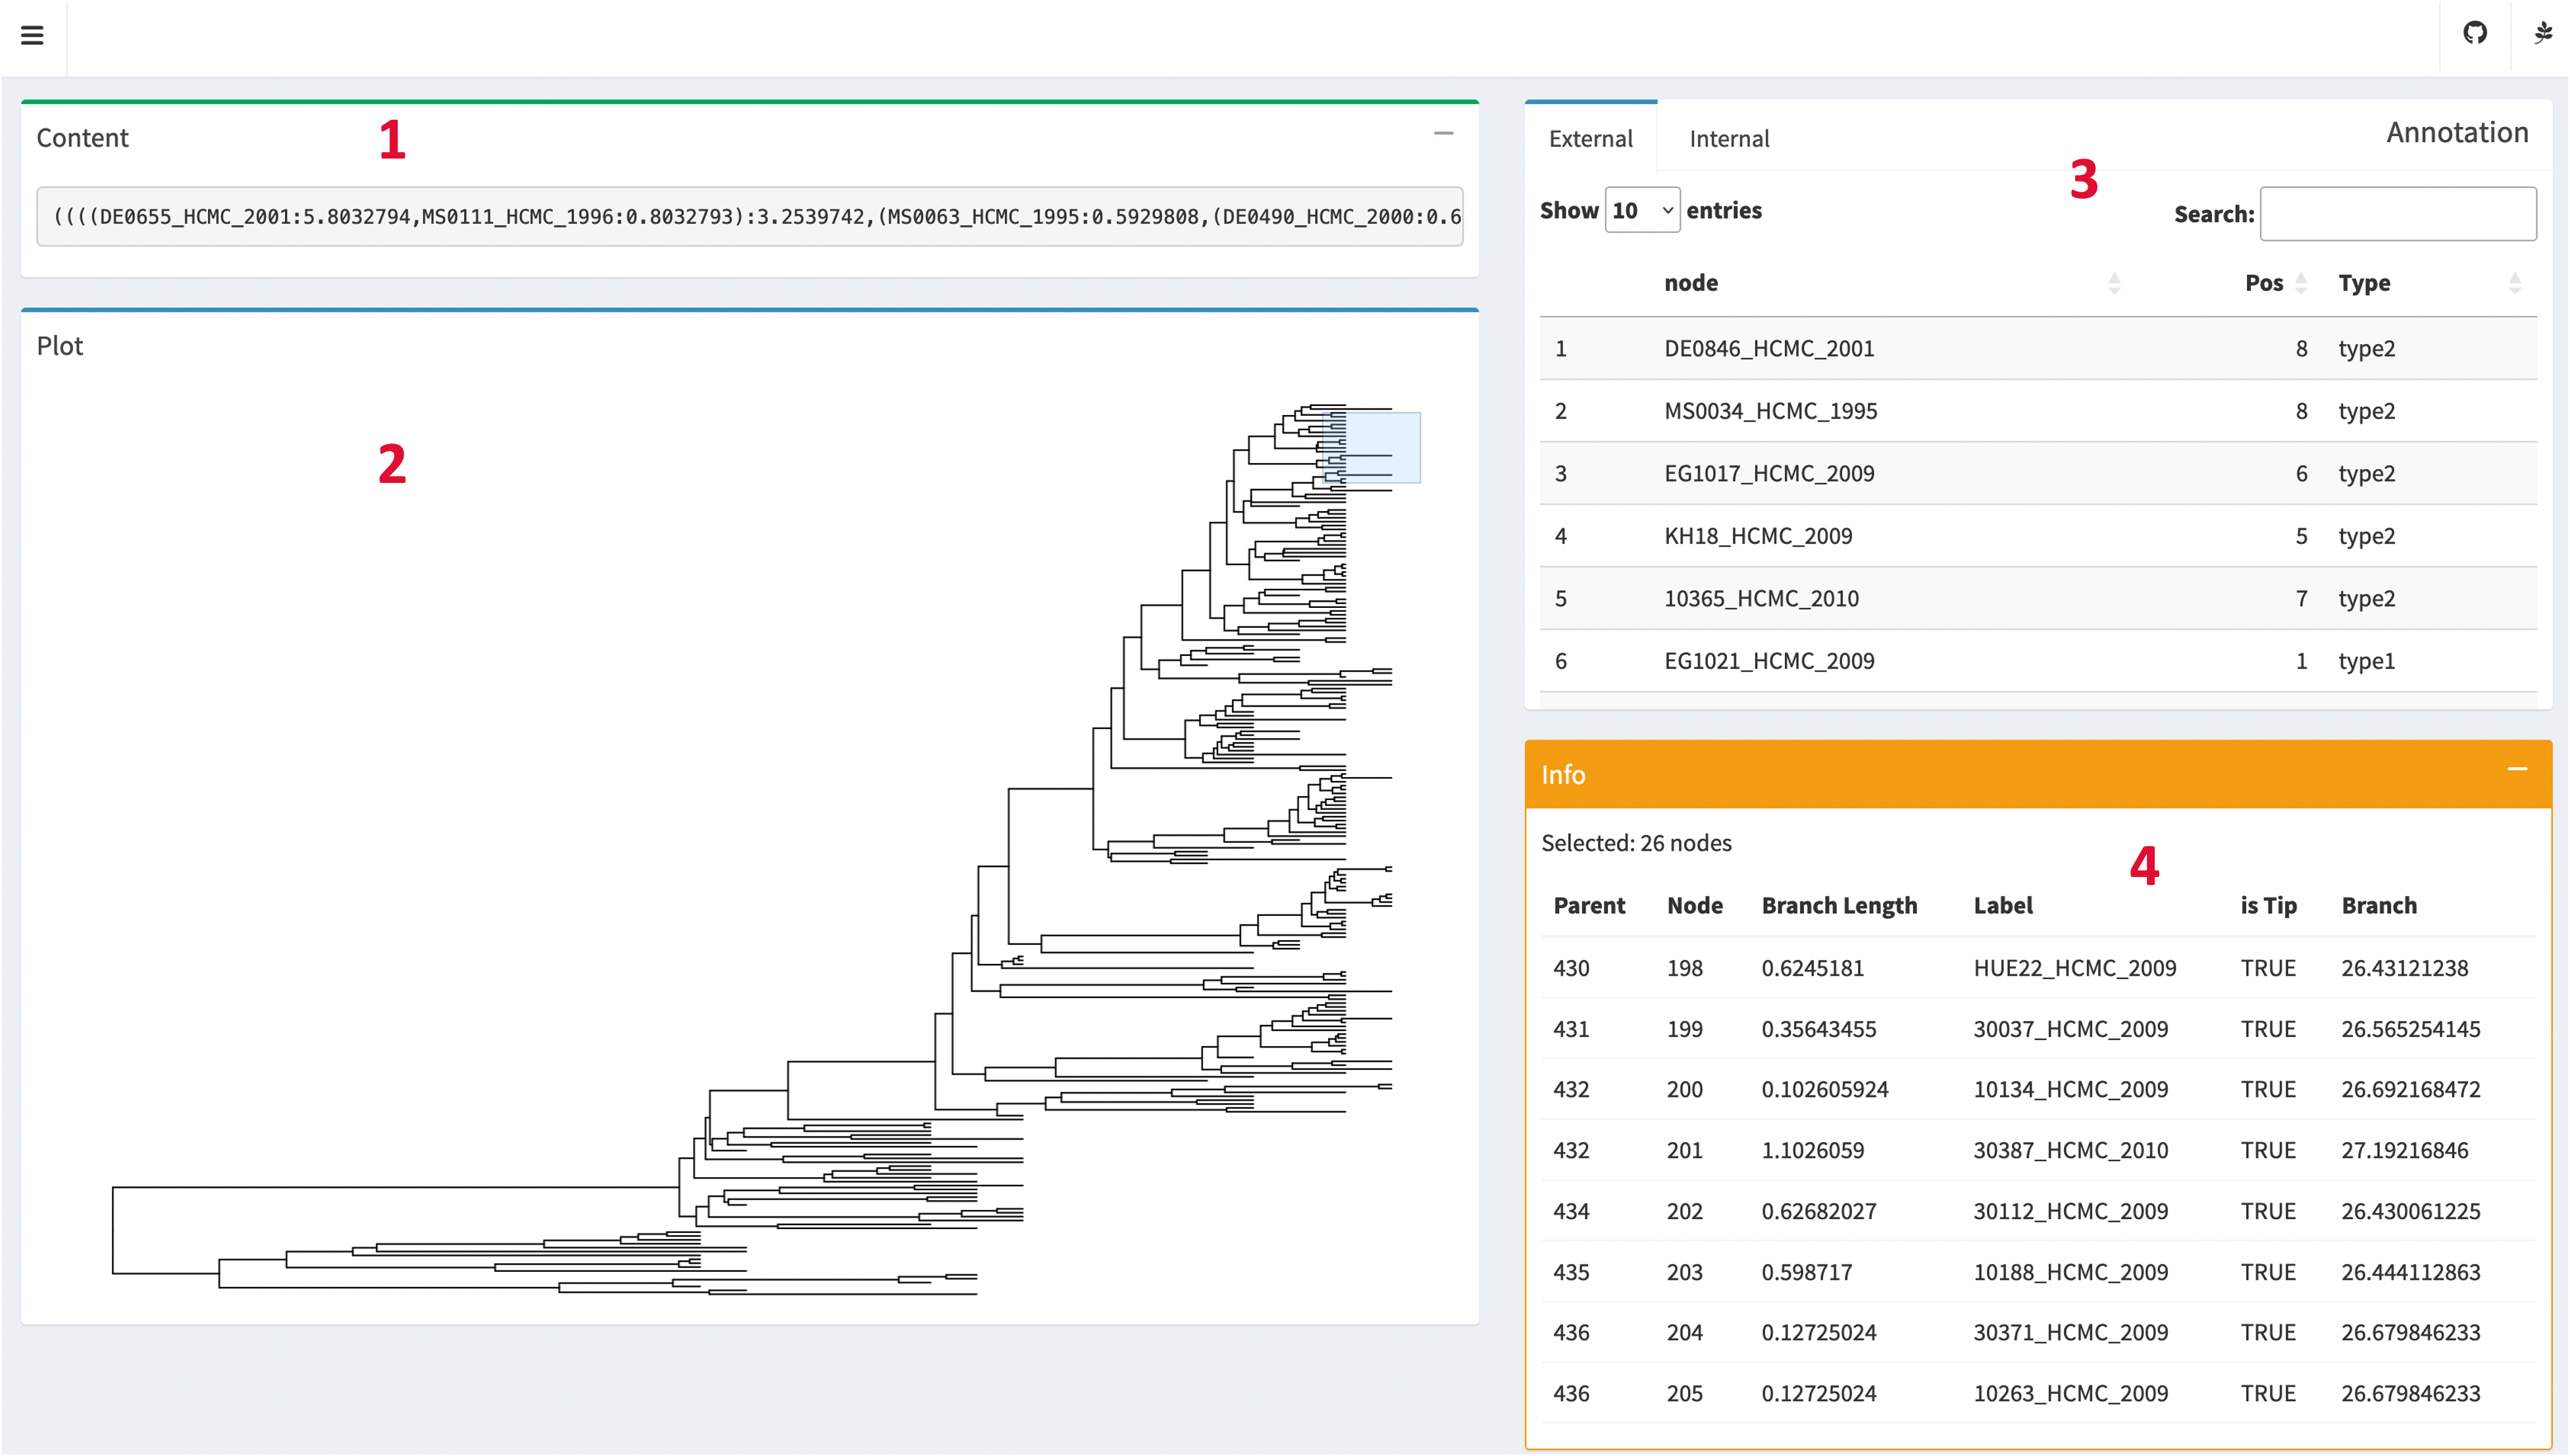
The Inspection page allows users to explore the details of the tree structure and topology, as well as view the uploaded annotation files using an interactive online table.
- Content Box: The Content Box displays the uploaded tree file in its original format. This component provides a convenient way to examine the raw tree data.
- Plot Box: The Plot Box visually represents the rectangular topology of the tree.
- Annotation Box: The Annotation Box presents user-uploaded annotation files in a tabular format. The Annotation Box supports pagination and search functionality, enabling users to navigate through large datasets and easily locate specific annotations of interest.
- Info Box: The Info Box displays information about the nodes. When users perform a selection by dragging the mouse cursor on the Plot Box, the Info Box updates to show details such as node labels, branch lengths, parent's ID and other additional information associated with the selected nodes.
Basic controls
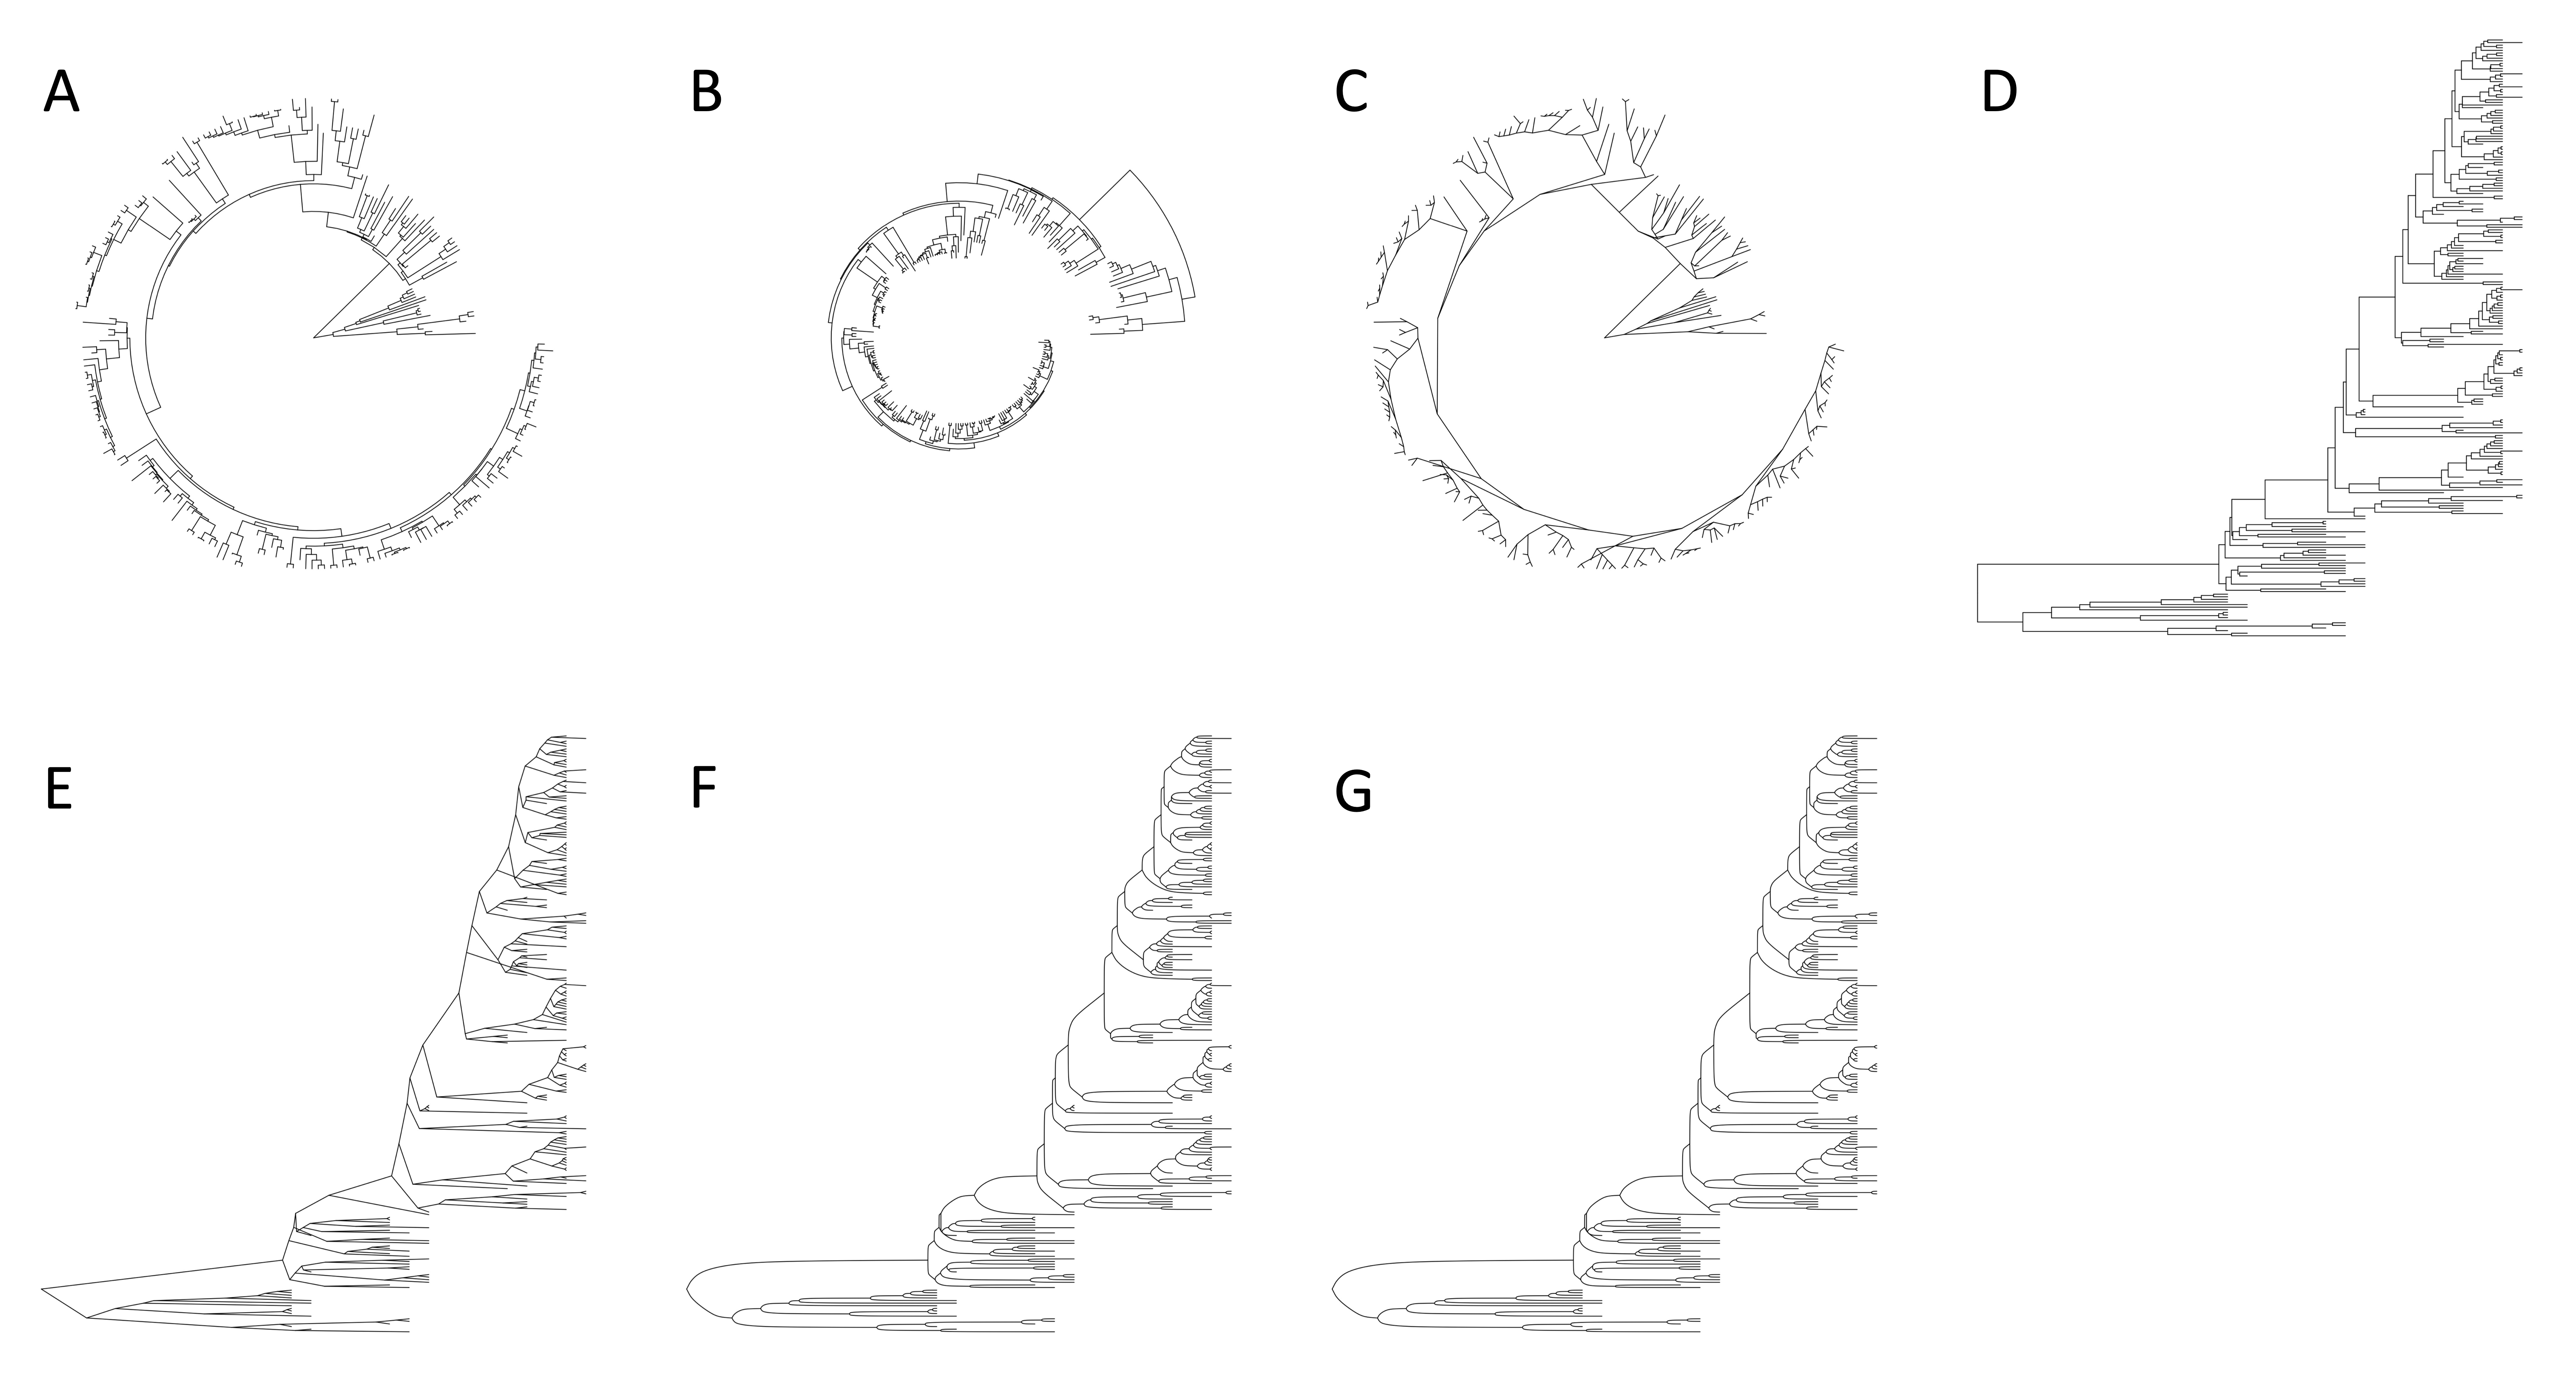
iPhylo Visual provides various layout options to display the tree in different styles. The available layout options include:
- circular (by default)
- inward circular
- daylight
- rectangular
- slanted
- ellipse
- roundrect
You can customize the basic display features of the tree within this section. The following features can be adjusted:
- Color: Use the color picker widget to define the color of all tree branches.
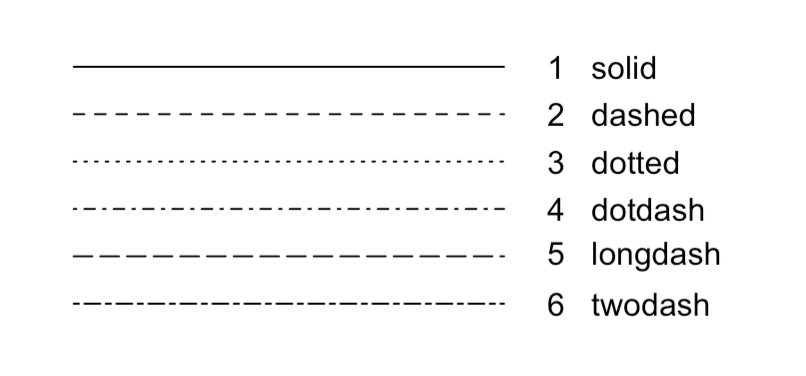
- Line options: Change the branch line type and width. Line type options are shown in the figure.
- Branch options: Select if the tree has branch length and set the branch start position. The branch start position feature creates blank space, enabling users to add additional content or annotations according to their specific needs.
- Rotation and Opening: For circular layouts, users can further customize the circular ring opening angle and rotation angle to achieve the desired circular representation.
Annotation Capability
iPhylo Visual simplifies the annotation process by allowing you to upload one single file that contains all the necessary annotation information. This file is in spreadsheet form, making users easy to understand and edit.
The columns in the table are expected to contain all the attributes of the tree nodes that you wish to annotate.
Note: The first column name must be "id", and the values in this column should correspond to the node name in the tree file. Failure to adhere to this format may result in mapping errors. This document provides example files for reference.
The attributes of the nodes are automatically synchronized and updated in each dropdown menu. Users can map the tree's display characteristics to node attributes. For example, in example session, selecting "Location" from the color dropdown menu will categorize the nodes based on their Location values and assign different colors accordingly.
This consolidated approach streamlines the annotation process and enables efficient management of all annotation data in one place. Please refer to the provided example files and ensure that your annotation files follow the specified format for successful mapping and visualization.
Leaf annotation
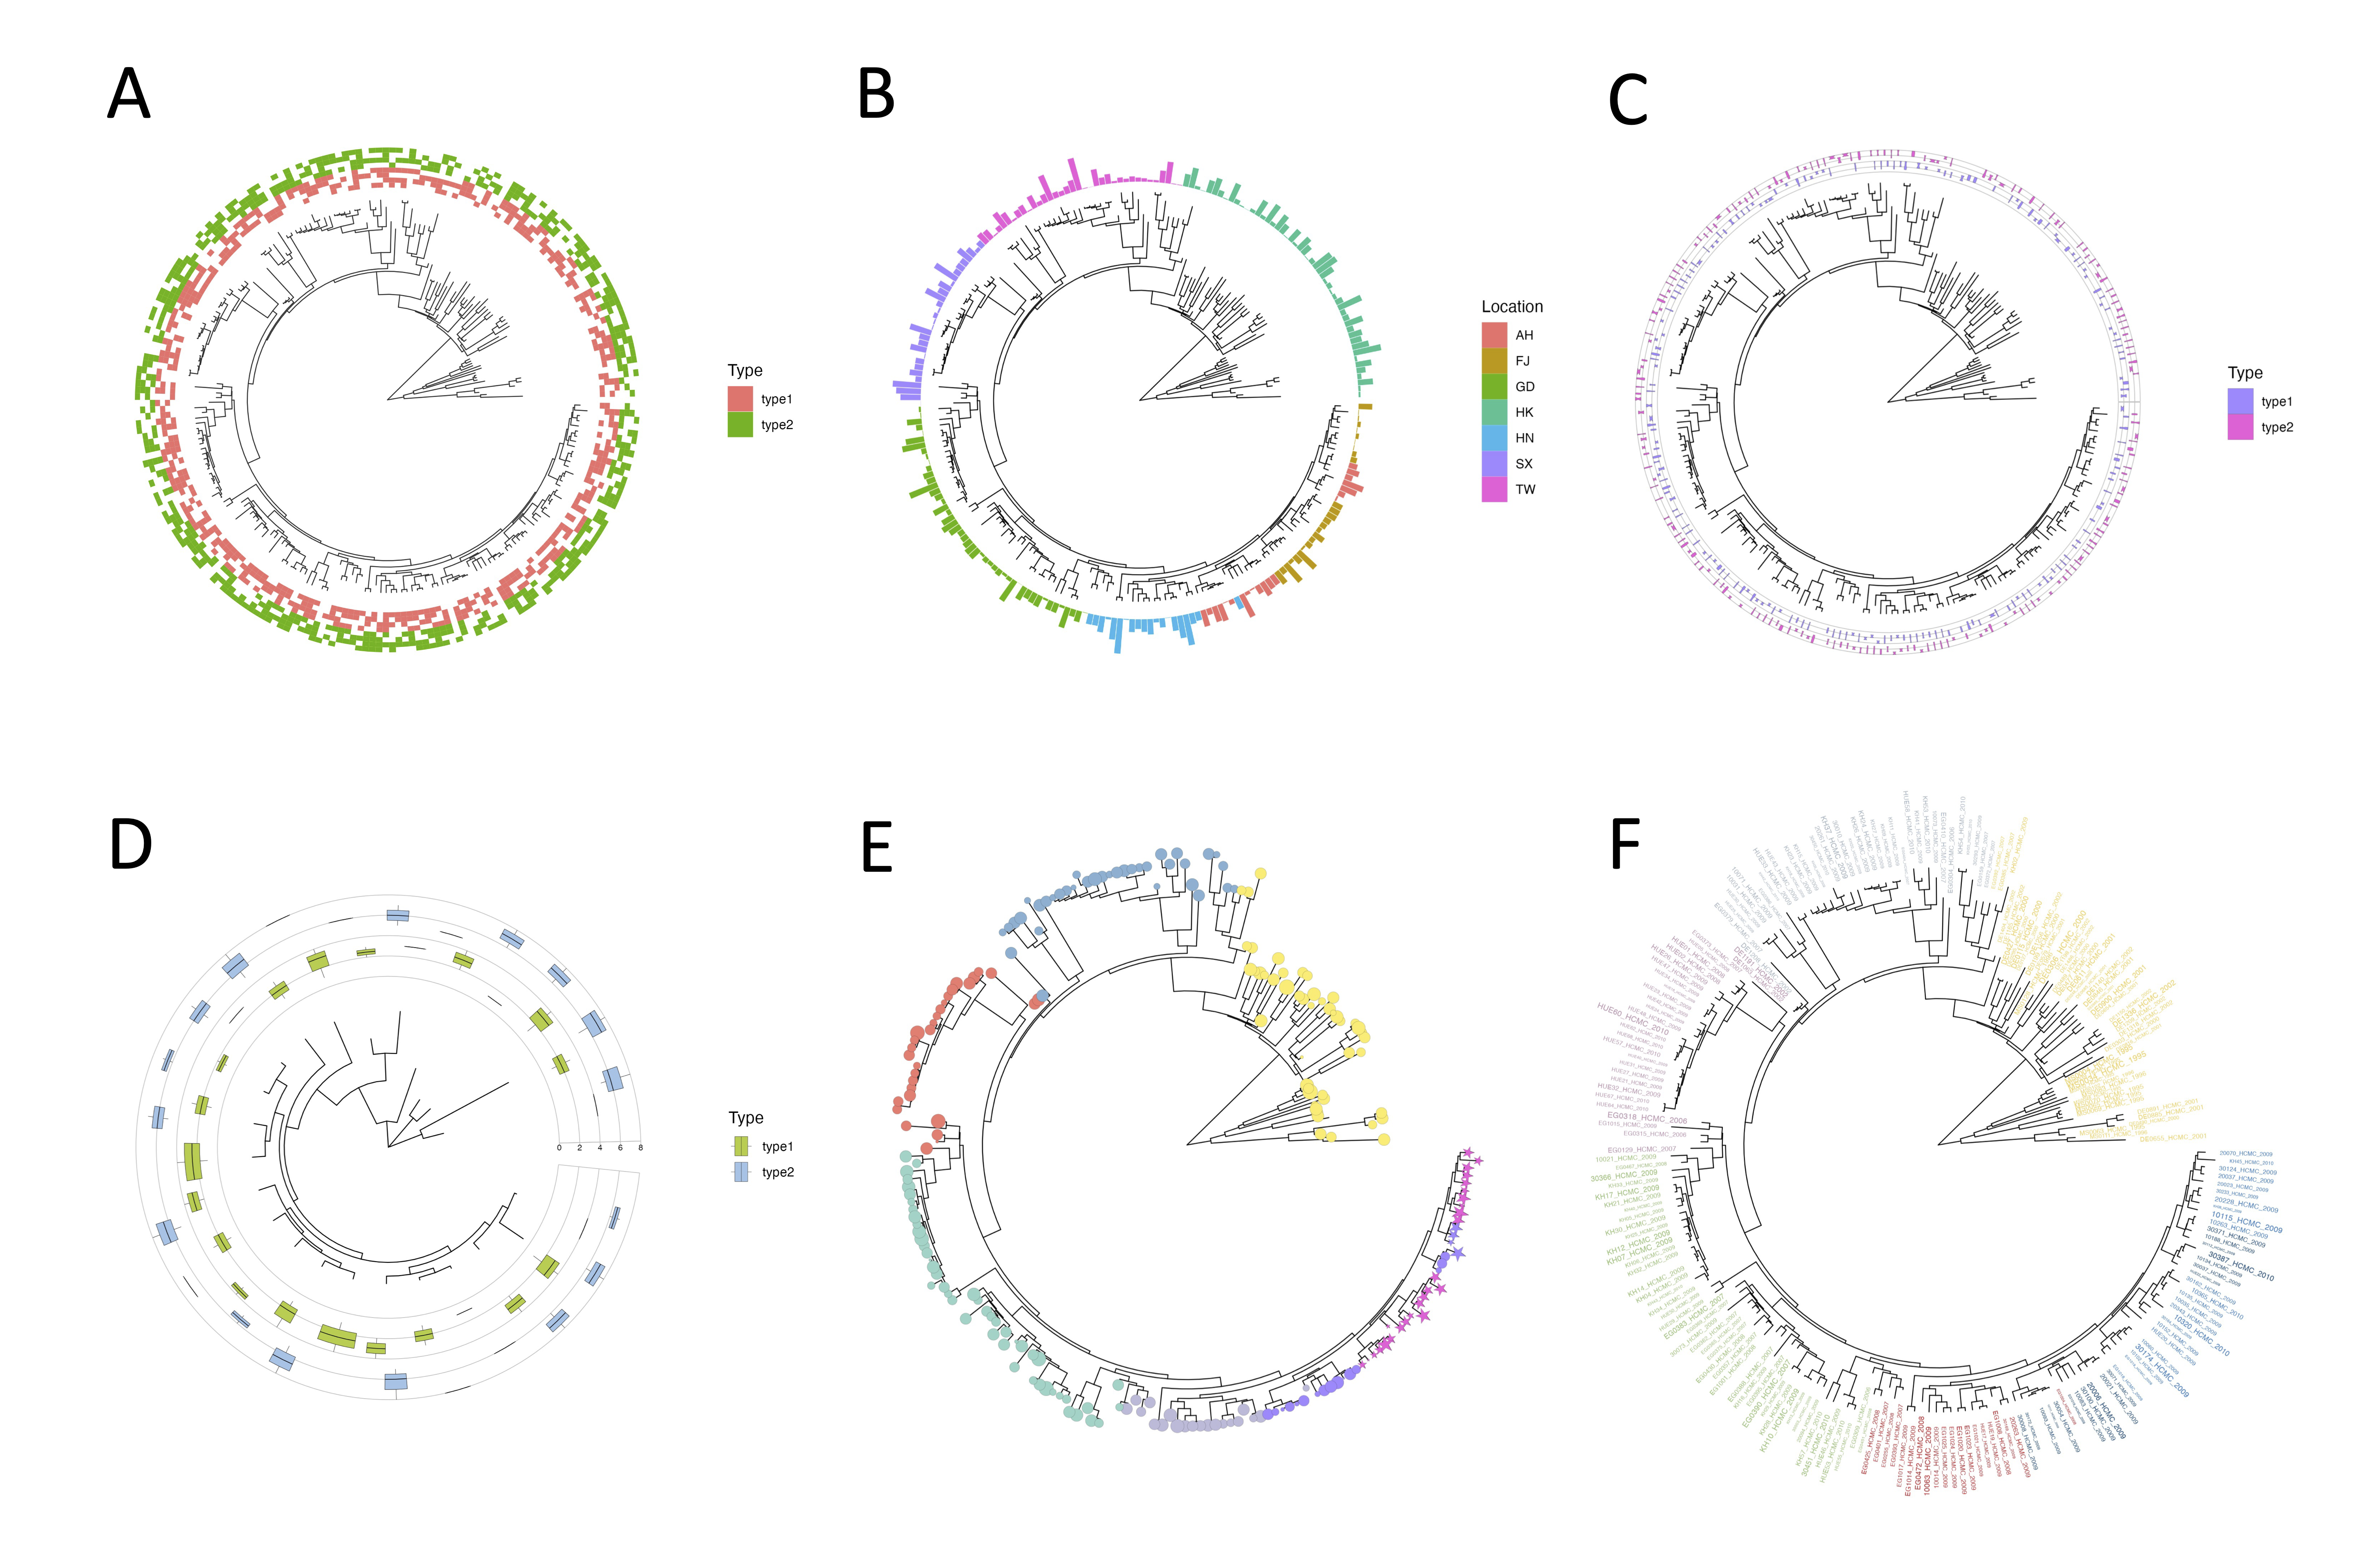
By utilizing leaf annotation, you can assign various graphical elements such as tile, bar, box, violin, tip point, and tip label to the corresponding leaf nodes. Here are the available options:
- Tile: Represents each leaf node with a rectangular tile.
- Bar: Displays each leaf node as a vertical bar.
- Box: Assigns a box shape to each leaf node.
- Violin: Assigns a violin shape to each leaf node.
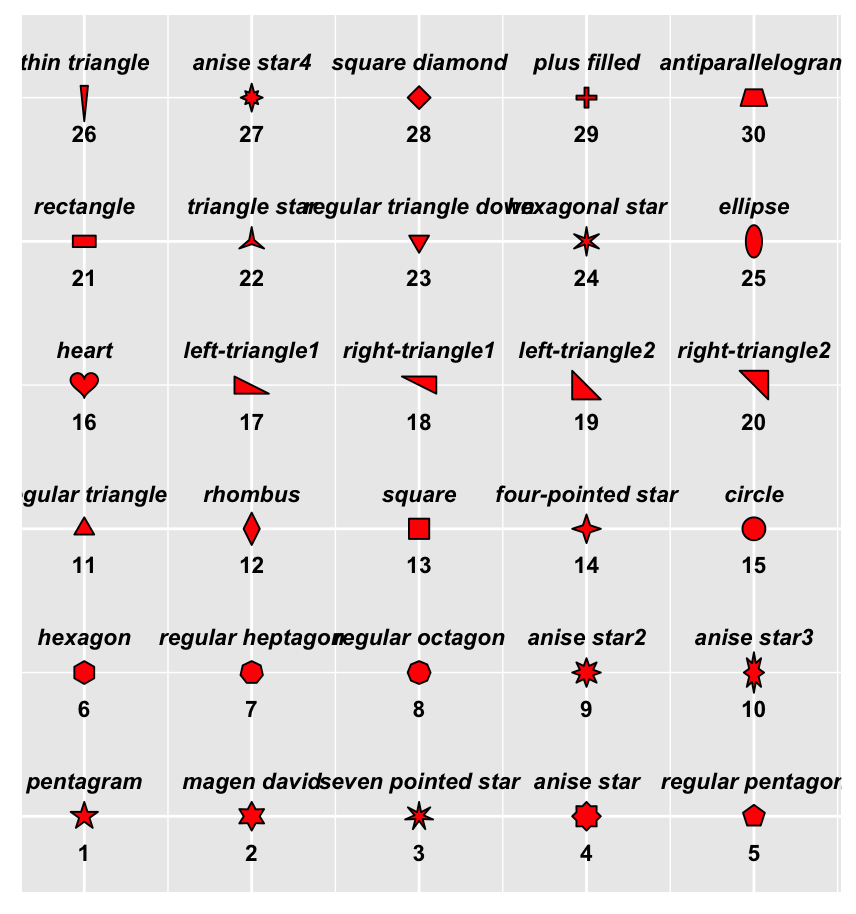
- Tip Point: Represents each leaf node with a distinct point. Different supported shapes are shown in the right figure.
- Tip Label: Enables the display of original or customized labels for each leaf node.
Node annotation
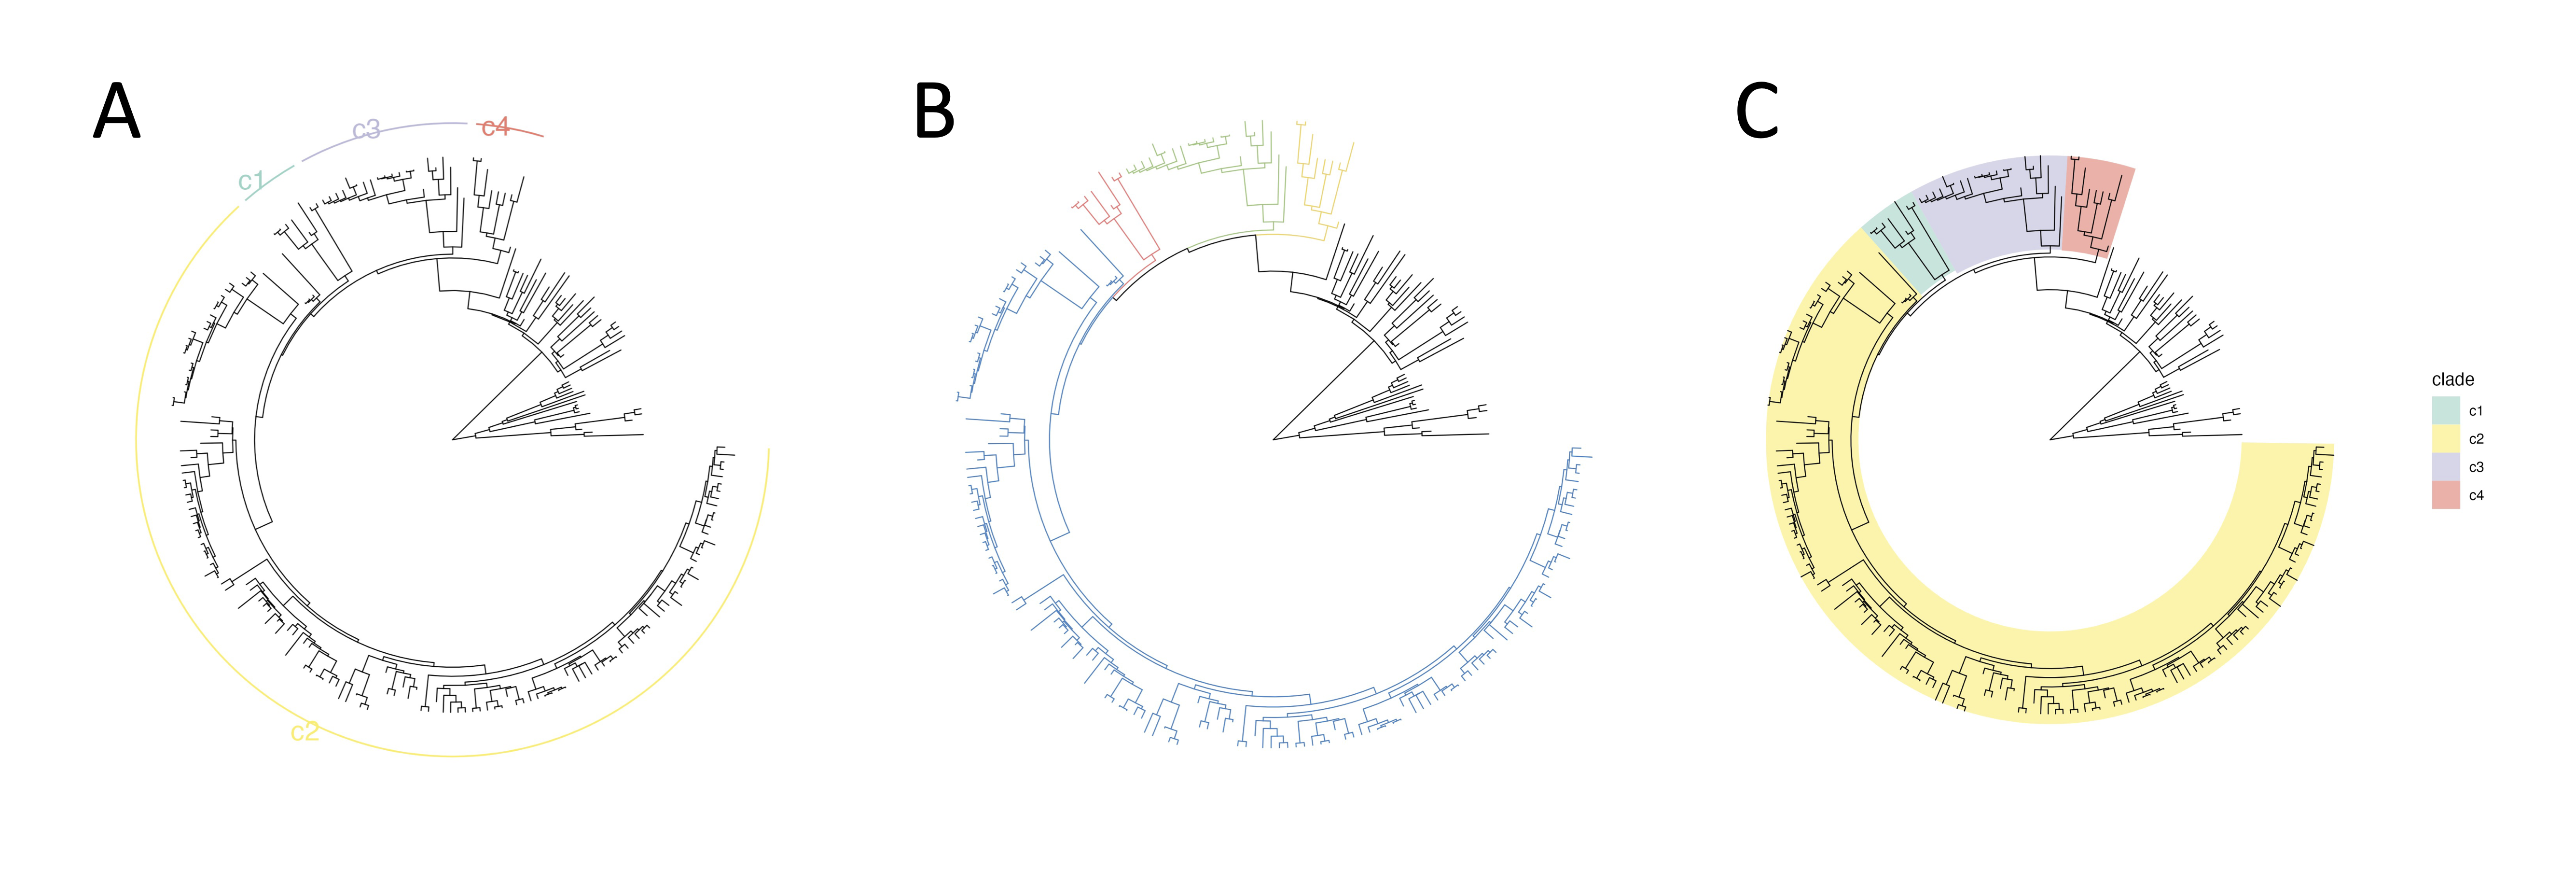
By utilizing node annotation, you can assign various visual attributes to specific clades. This includes the assignment of strip, clade branch color, and background color. Here are the available options:
- Strip: Assigns strips with text labels to specific clades.
- Color branch: Allows customization of the color of clade branches.
- Highlight: Displays a background box behind branches. You can choose whether the background box is set at the bottom of all layers.
Manual option
The "manual" input option gives you the flexibility to define the desired range for a specific parameter. For example, when configuring the color range, you can input specific color values or define a custom color gradient that aligns with your preferences.
Canvas and Legend
Using the Legend panel allows you to adjust the size and position of the canvas and legend, which is helpful when the phylogenetic tree and annotation legend are too large or when there are too many legends to display all the information.
When drawing phylogenetic trees with many branches, it is recommended to appropriately increase the canvas width and canvas height.
- Canvas Width:
- Description: Determines the width of the entire canvas or plotting area where the visualization will be displayed.
- Usage: Adjust this parameter to control the horizontal size of the entire visualization canvas.
- Canvas Height:
- Description: Specifies the height of the canvas or plotting area.
- Usage: Use this parameter to control the vertical size of the entire visualization canvas.
- Legend X Position:
- Description: Sets the horizontal position of the legend within the canvas.
- Usage: Adjust this parameter to move the legend horizontally, helping to optimize its placement.
- Legend Y Position:
- Description: Determines the vertical position of the legend within the canvas.
- Usage: Use this parameter to control the vertical placement of the legend in relation to the canvas.
- Legend Scale:
- Description: Defines the scale or size of the legend.
- Usage: Adjust this parameter to control the overall size of the legend, making it more prominent or compact.
- Legend Direction:
- Description: Specifies the orientation or direction of the legend, whether it is horizontal or vertical.
- Usage: Use this parameter to choose the orientation that best fits your visualization layout.
These parameters provide control over the overall canvas dimensions, legend placement, size, and orientation, allowing users to customize the appearance of their visualizations to suit their needs.
Session
iPhylo Visual offers a session saving feature that allows you to save your work at any point during the annotation process. Simply click the Save Session button to save your data and selected options for the current page.
To restore your work and retrieve your saved data, you can use the Upload Session component to upload the session file with the ".iphylo" extension.
Thank you for choosing iPhylo Visual for your phylogenetic tree visualization and annotation needs.
Example files
| Title | Basic Tree | Leaf Annotation | Node Annotation | Session | Download Zip |
|---|---|---|---|---|---|
|
Demo Tree |
tree.nwk | demo_leaf.csv | demo_node.csv | DemoTree.iphylo | |
|
Metabolism |
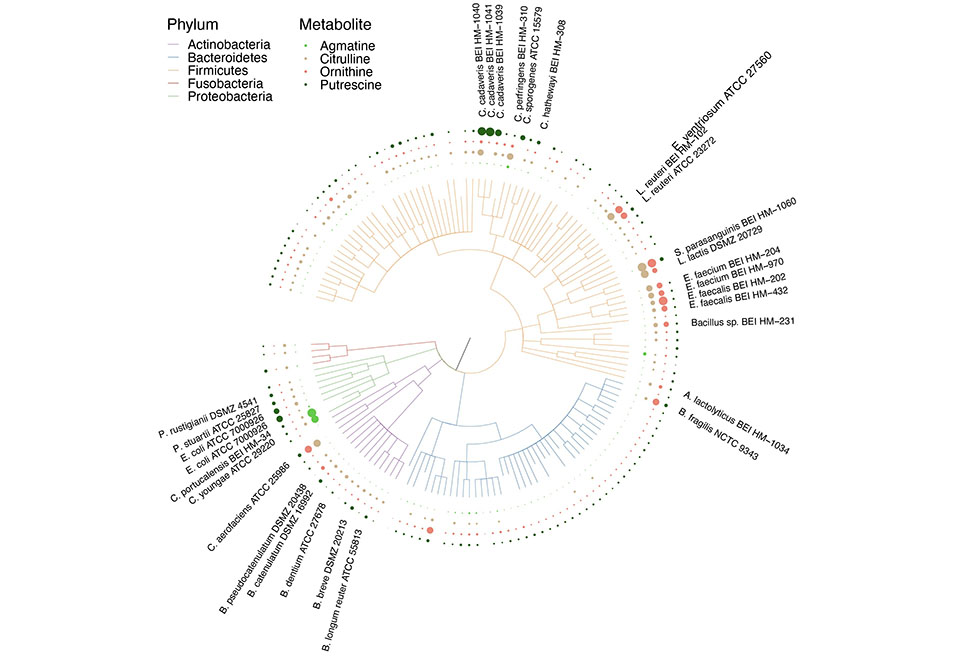
metabolism_tree.nwk | metabolism_leaf.csv | metabolism_node.csv | metabolite.iphylo | |
|
Glacier |
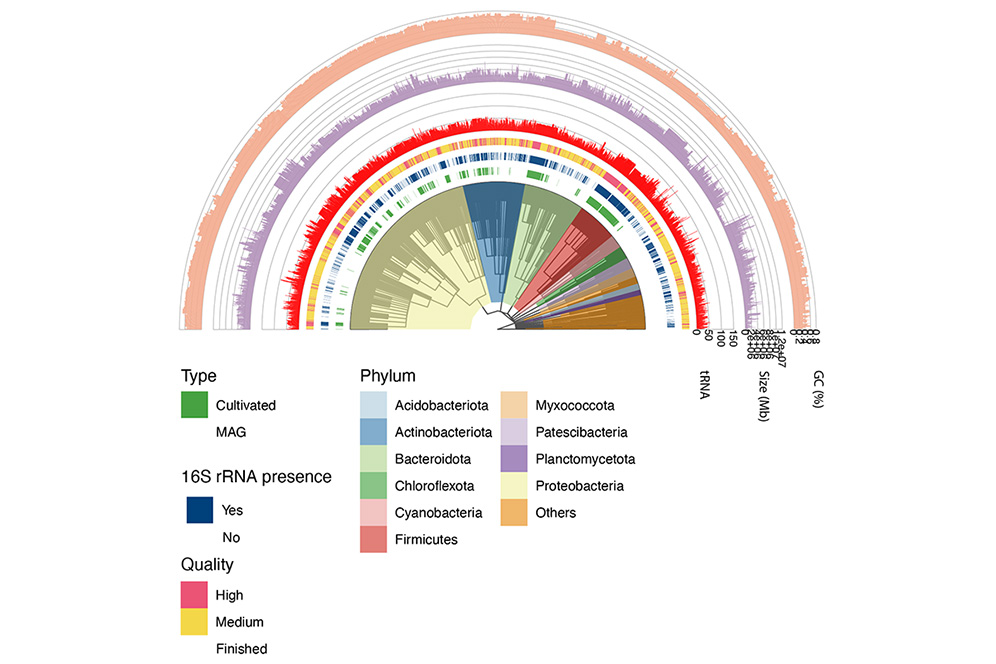
glacier_tree.nwk | glacier_leaf.csv | glacier_node.csv | glacier.iphylo | |
|
Heatmap |
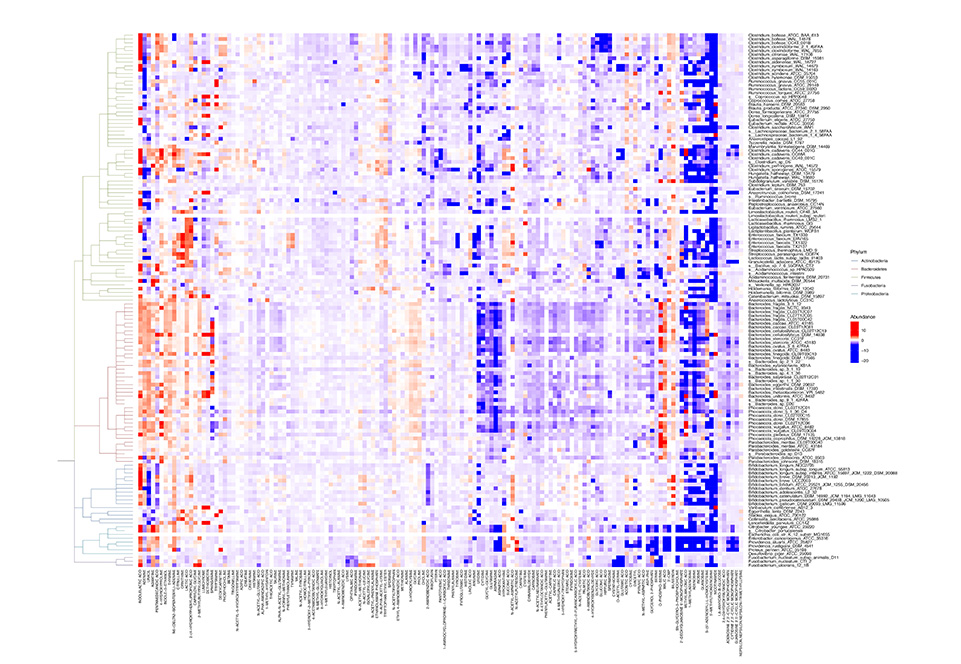
heatmap_tree.nwk | heatmap_leaf.csv | heatmap_node.csv | heatmap.iphylo | |
|
Chemical Library |
chemical_tree.nwk | chemical_leaf.csv |
None |
chemical.iphylo | |
|
Statistics |
statistics_tree.txt |
None |
statistics_node.csv | statistics.iphylo |
Phylo-Tree Linker Example
| Title | Tree #1 | Tree #2 | Edge link | Tree #1 highlight | Tree #2 highlight | Session | Download Zip |
|---|---|---|---|---|---|---|---|
|
Correlation Tree |
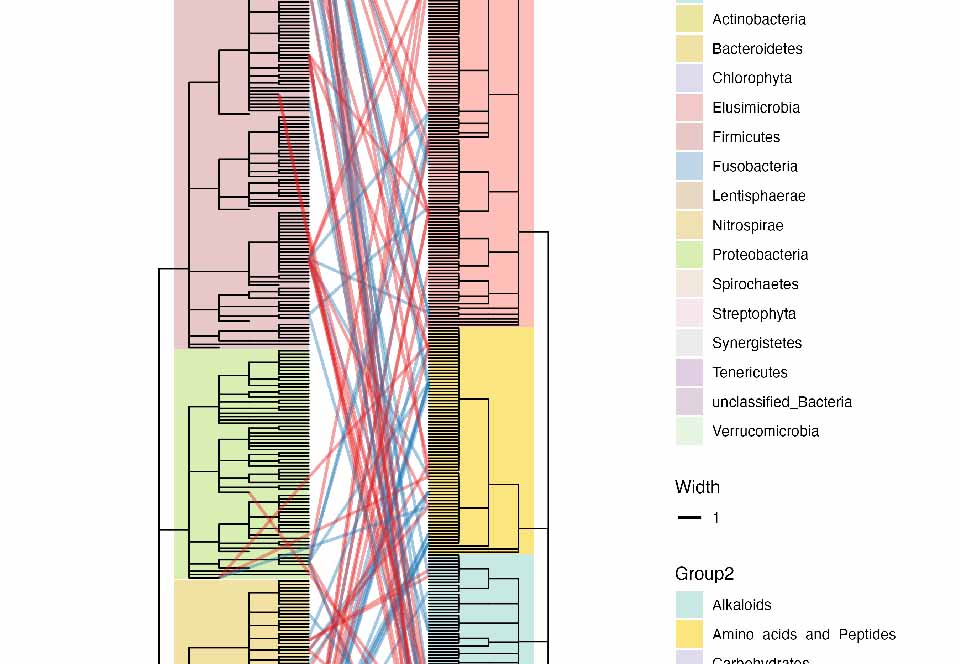
corr_tr1.txt | corr_tr2.txt | corr_edge.csv | corr_tr1_highlight.csv | corr_tr2_highlight.csv | corr.iphylo | |
|
Abundance Tree |
abun_tr1.txt | abun_tr2.txt | abun_edge.csv | abun_tr1_highlight.csv | abun_tr2_highlight.csv | abun.iphylo |
